Map
You can't fix — or trust — what you can't see.
Glymr maps the systems, spreadsheets, data sources, flows, ownership, and unofficial tools that shape how your organization actually operates, so leaders and AI systems have an accurate picture to work from.
Data Landscape Mapping is Glymr's service for creating an accurate, organization-wide view of where business-critical data lives, how it moves between systems, who owns it, and which official and unofficial tools employees actually depend on, replacing assumptions with a verified picture leadership can act on.
Why This Matters
Leaders cannot improve decisions, plan technology investments, or use AI effectively when they do not know where business-critical data actually lives, how it moves, who owns it, or which unofficial systems employees still depend on. Most organizations discover this gap the hard way: during a system migration, an M&A integration, or an AI initiative that turns up data no one remembered existed.
The gap is usually bigger than leadership expects. Systems accumulate through growth and acquisition; "shadow IT" spreads because official tools didn't fit a team's actual workflow; and institutional memory about how systems connect quietly walks out the door with the people who built them.
"Data Landscape Mapping really helped us get a handle on the complexity of our data. Having that map in front of us made it much easier to make strategic decisions, plan improvements and get new team members up to speed. It was a game changer for the way we talked about our data."
What Glymr Does
- Inventories the systems, platforms, spreadsheets, and data sources actually in use across the organization, not just the ones on the approved list
- Maps how data flows between systems, including manual workarounds and undocumented integrations
- Identifies data ownership and closes gaps where no one is officially responsible
- Surfaces redundant, retired, or unofficial ("shadow IT") systems still in active use
- Documents dependencies and risks so technology and process decisions are made with full visibility
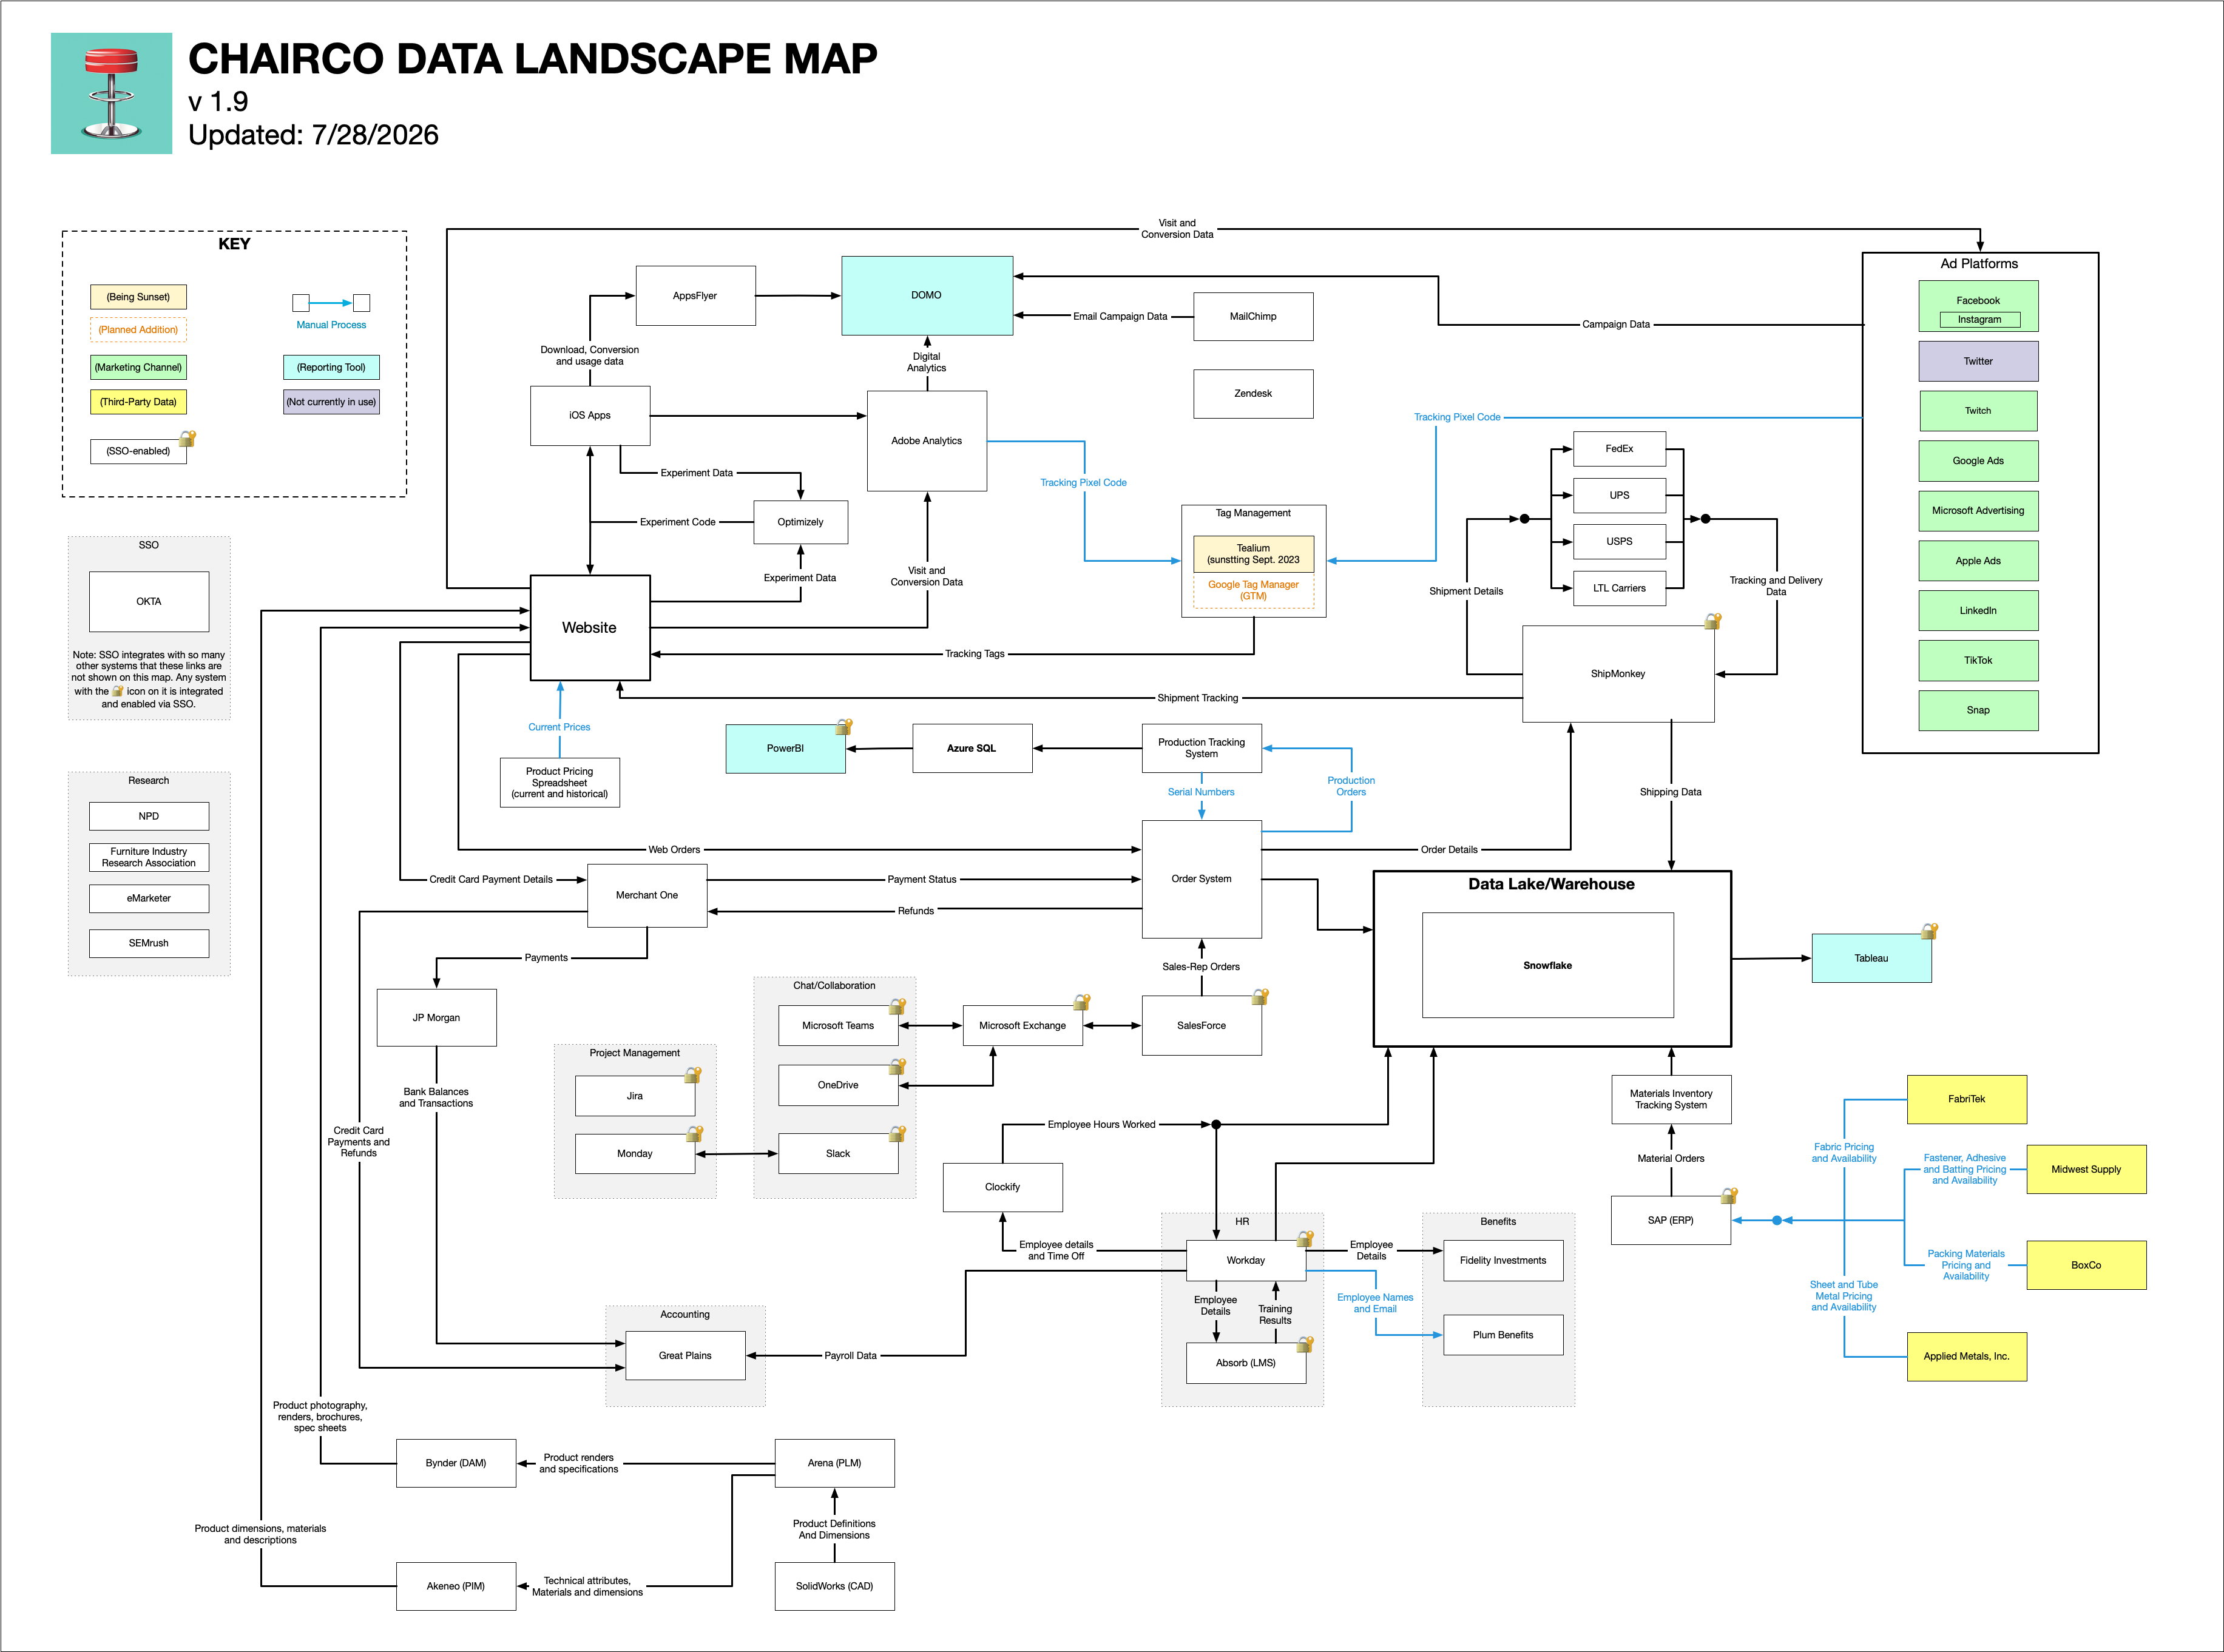
Sample Data Landscape Map
Here's an example of what a completed Data Landscape Map can look like, built for a fictional company:
What One Data Landscape Map Found
Every figure below comes from a single engagement at a mid-market company that had grown through acquisition.
Deliverables
- A structured Data Landscape Map covering systems, data sources, flows, and ownership
- Findings on redundant, deprecated, or unofficial systems still in use
- Identified dependencies and risk areas
- Recommendations for consolidation, ownership assignment, and simplification
Who This Is For
Data Landscape Mapping is most valuable for:
- Organizations that have grown through acquisition and inherited fragmented, overlapping systems
- Leadership teams that suspect, but can't prove, they're paying for redundant or unused technology
- Companies preparing for an M&A transaction, system migration, or major technology decision
- Organizations preparing their data foundation for AI tools and copilots
- IT and data leaders who need an accurate picture before they can plan improvements
"If I had something like this [Data Landscape Map] a year ago, my life would have been MUCH easier."
Related Reading
Data Landscape Mapping is often the first step toward Process Mapping: once you know where the data and systems are, the next question is how the work built around them actually happens.
See what your systems and data actually look like.
A short call to scope a Data Landscape Map: what it would cover, what you would get, and what it takes from your team.